

E-Learning Maturity Model
Version Two Assessment Interpretation
Once the assessment of capability is undertaken, the results can be interpreted. Figure 1 demonstrates some typical results showing a single process capability as assessed for five different sample institutions.
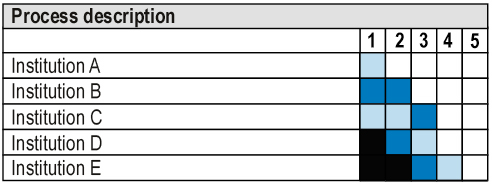
Figure 1: Example practice result comparing five institutions
Institution A is not performing the process well, with only evidence of some ad-hoc attempts shown by the partially adequate rating supplied for level 1 and the absence of any capability in the other levels.
Institution B is significantly more capable in the process than either A or C with evidence that the process is mostly performed well (the largely adequate rating of level 1) and in a planned fashion (the largely adequate rating of level 2). Note that despite there being evidence at level 2 of planning, this appears to be done without any attempt for consistency within the institution as no capability is shown at level 3.
Institution C on the other hand, while not as capable as B, shows evidence of having defined standards or guidelines for performing the process (level 3). However, these do not appear to be having an impact on actual e-learning projects as shown by the lower ratings at level 1 and level 2.
Institution D shows a pattern of very good performance of the process (fully adequate rating at level 1), supported by largely adequate planning (level 2) and an initial set of standards or guidelines (partially adequate rating at level 3). This is perhaps the expected pattern of capability development, building from a base of ad-hoc behaviours that are becoming more standardised as the institution has more experience in e-learning.
Finally, Institution E performs the process very well (fully adequate rating at level 1) supported by effective planning (fully adequate rating at level 2), largely adequate standards and guidelines (level 3) and an initial programme of evaluation and measurement of process performance (level 4).
Further analysis of the results in this example suggests that institutions C and E will provide potential examples of useful standards, guidelines and policies, while institutions D and E (and to some extent B) will provide individual examples of how to perform the process well. A more in-depth analysis can then be undertaken if necessary, dropping down to the level of individual practices to determine shared or complementary areas of strength or weakness.
Comparison across groups of processes provides an institution with the ability to identify aspects of related weakness that can be addressed strategically. Priorities can be easily identified by either comparison with the wider sector, or by comparing process ratings within an institution. Action plans can then be developed with reference to the practices within each of the process dimensions.